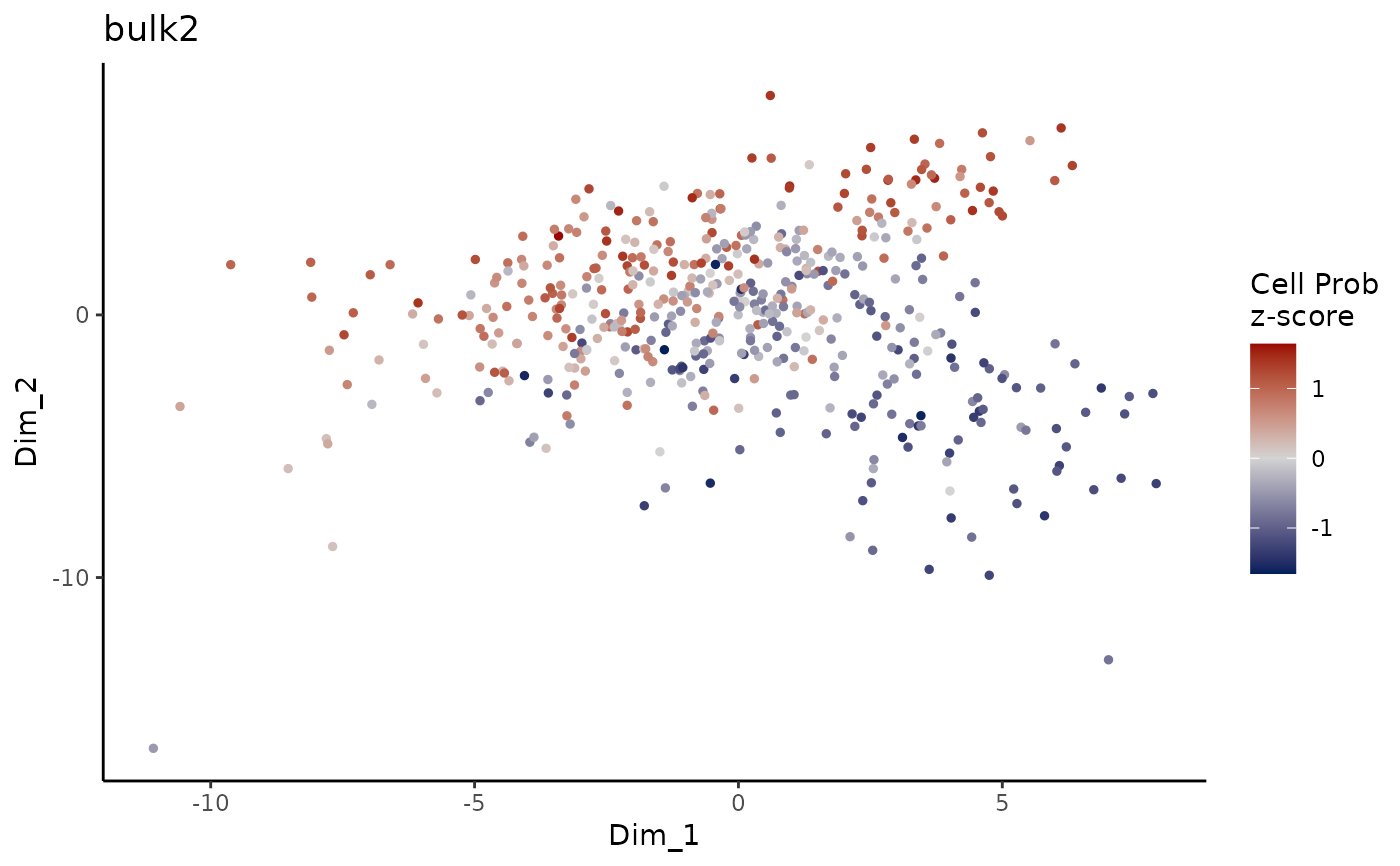
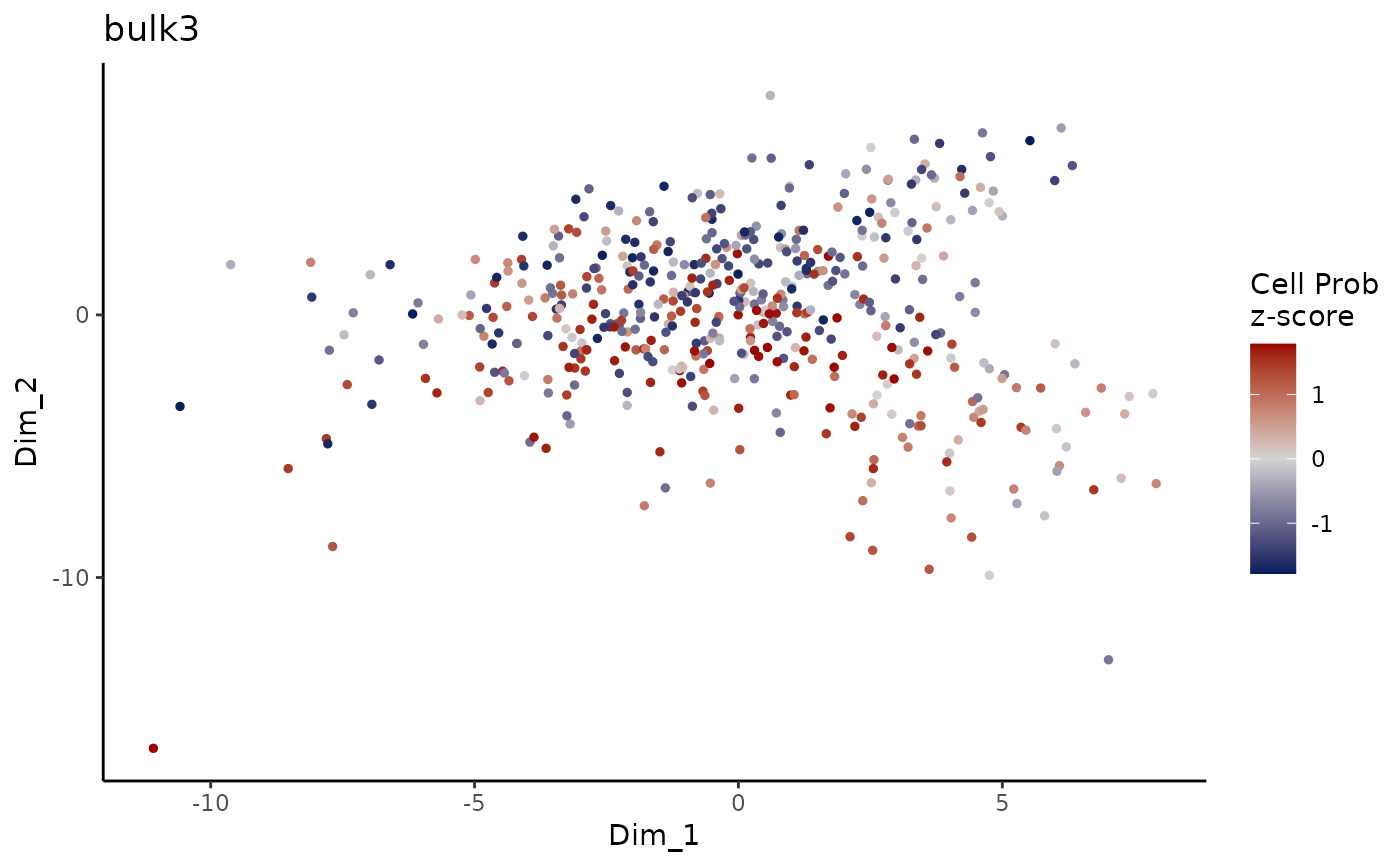
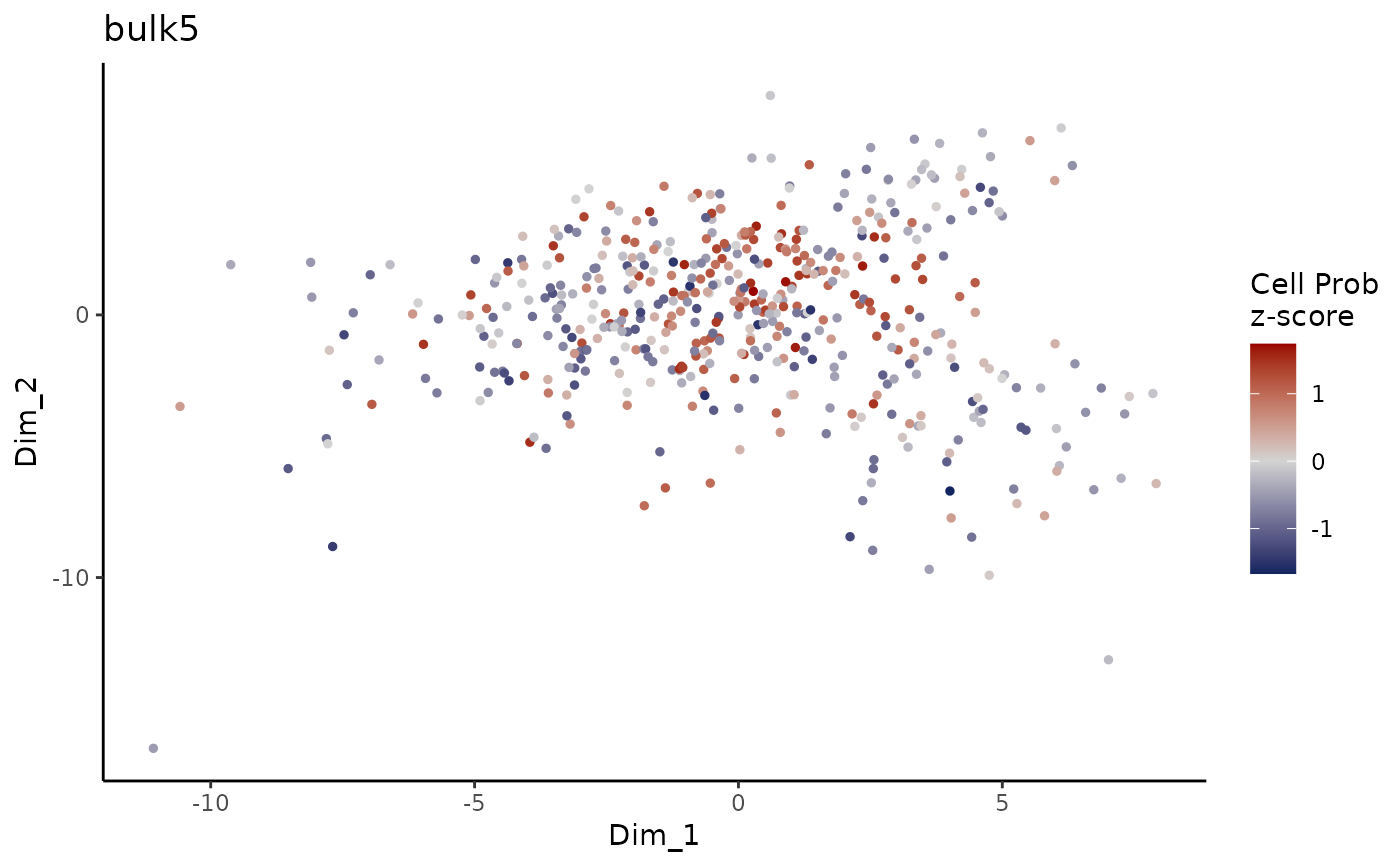
Plot ConDecon_obj
PlotConDecon.RdPlot ConDecon's predicted relative cell probability z-scores for each sample
Usage
PlotConDecon(
  ConDecon_obj,
  umap = ConDecon_obj$TrainingSet$latent[, 1:2],
  samples = NULL,
  pt.size = 1,
  cells = NULL,
  title_names = samples,
  relative = TRUE,
  upper_quant = 0.95,
  lower_quant = 0.05
)
Arguments
- ConDecon_obj
ConDecon object (output from RunConDecon)
- umap
2-dimensional coordinates of reference single-cell data (default = first 2 dimensions of latent space)
- samples
Vector of query bulk sample(s) to plot (default = NULL, plot all samples)
- pt.size
size of the points plotted (default = 1)
- cells
Vector of cells from the reference single-cell data to plot (default = NULL, plot all cells)
- title_names
Title of each plot (default = samples, use NULL for no title)
- relative
Logical indicating whether to plot the relative abundance (Z-scores) or the raw abundance (default = TRUE)
- upper_quant
When relative = FALSE, plot the raw abundance removing the upper quartile or the long tails of the distribution (default = 0.95)
- lower_quant
When relative = FALSE, plot the raw abundance removing the lower quartile or the long tails of the distribution (default = 0.05)
Examples
data(counts_gps)
data(latent_gps)
data(bulk_gps)
data(variable_genes_gps)

# For this example, we will reduce the training size to max.iter = 50 to reduce run time
ConDecon_obj = RunConDecon(counts = counts_gps, latent = latent_gps, bulk = bulk_gps,
variable.features = variable_genes_gps, max.iter = 50)
#> Warning: Y is the same as X, did you mean to use dist instead?

# Plot ConDecon relative cell prob
PlotConDecon(ConDecon_obj)